
Direct Headspace Mass Spectrometry for Food Authentication: No Sample Prep Required
Direct headspace mass spectrometry addresses a category of analytical questions that chromatography handles poorly. Not because the instrumentation isn’t capable, but because the questions don’t require it. Is this batch of tea from the right supplier? Does this olive oil actually come from where the label says? Has something migrated from the packaging into the product?
For questions like these, the standard response – extract, separate, detect, interpret – introduces more complexity than the problem requires. What’s needed is a fast, reliable signal that a sample is what it claims to be. Or isn’t.
The sample goes into a standard headspace vial. An autosampler agitates it, draws the volatile fraction with a gas-tight syringe, and injects it directly into the SICRIT® direct injection module coupled, gas-tight, to the MS. No chromatographic column, no solvent, no sample preparation. This chromatography-free approach yields a full mass spectrum in under two minutes. Repeated across replicates, the result is a reproducible chemical fingerprint that reflects the composition of the sample.
What This Method Is – and What It Isn’t
The setup is straightforward: a sealed vial, an autosampler, and an ion source coupled directly to the MS. SICRIT® uses soft ionization via cold plasma, preserving intact molecular ions and covering a wide range of volatiles without source-switching or compound-class restrictions.
What this method is not: a replacement for chromatography when separation is the point. Co-eluting compounds are not resolved. Regulatory confirmation methods requiring retention times remain in their domain. But for fingerprinting, classification, and rapid screening, particularly when samples are chemically similar and the question is one of differentiation rather than quantification, automated headspace MS delivers answers that chromatography would take far longer to produce.
Tea Authentication by Direct Headspace MS: 94% Classification Accuracy
Food authenticity testing rarely gets harder than tea. The aromatic profile is chemically complex, with terpenes, polyphenols, and their isomers at varying concentrations, and differences between varieties, brands, and blends are often subtle. Mislabeling, adulteration, and undisclosed blending are documented problems in the global tea trade.
Thirteen different teas from four brands were placed into 20 mL headspace vials and loaded onto an autosampler. Each sample was agitated for five minutes at 30°C, and 1 mL of headspace was injected at 1000 µL/sec into the direct injection module at 300°C coupled to a compact single-quadrupole instrument equipped with a SICRIT® Ion Source. Each sample was measured six times. Total analysis time: two minutes per sample.
Profiles were processed using multivariate classification software with a standard PCA workflow. All 13 teas separated cleanly. Five-fold cross-validation with 20% of spectra withheld confirmed 94% classification accuracy. The masses driving separation are chemically interpretable: peppermint clusters around m/z 153 (menthol), Minze Zitrone around 135 and 153 (limonene and menthol), while more complex blends like BioGewürz and Karibische Mango occupy closer regions due to overlapping terpene isomers at varying intensities.
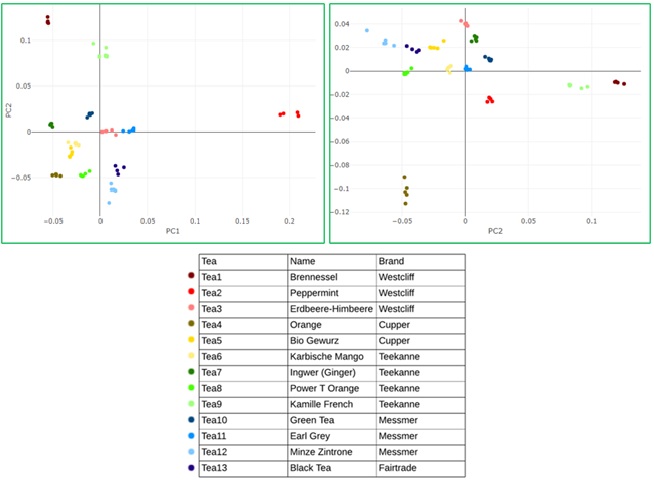
Figure 1: PCA score plot of 13 tea varieties from four brands. All samples clearly separated; excellent reproducibility across replicates.
To push the approach further and to see whether flavor adulteration can be detected or the contents of a particular blend determined, three teas – Green, Ginger, and Black – were mixed at ratios of 30:70, 50:50, and 70:30. A PCA-LDA model separated all combinations, including the pure varieties and each blend ratio, at 96% cross-validation accuracy. Characteristic masses held consistent across mixtures: m/z 205 tracked with Ginger, m/z 137 and 153 with Black tea. Even at a 30% inclusion level, the chemical signature of each component remained detectable and distinguishable.
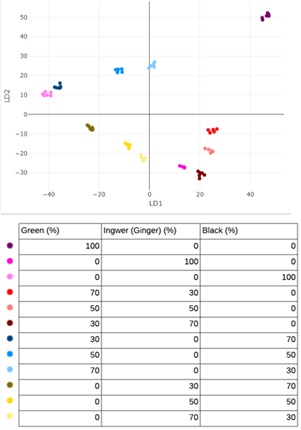
Figure 2: PCA-LDA score plot of three tea varieties and six blend ratios (30:70, 50:50, 70:30). Five-fold cross-validation accuracy: 96%.
Extractables and Leachables Detection in Tea Bags Without Sample Preparation
The most practically striking result came from a comparison that wasn’t part of the original authenticity question. Five teas were measured both as loose leaves and as the corresponding tea bag material, same brand, same variety, different physical form. The goal was to determine whether extractables and leachables from the packaging material could be detected directly in the product, without any dedicated sample preparation.
The PCA separated leaves from bags consistently across all five varieties. The masses responsible, m/z 223 and 371, are associated with plasticizers. The 371 signal corresponds to Dioctyl adipate, a known plasticizer used in modified cellulose tea bag materials. It appeared not only in the bag profiles but also in the tea leaf profiles, suggesting that leachable components had already migrated from the packaging into the product prior to steeping.
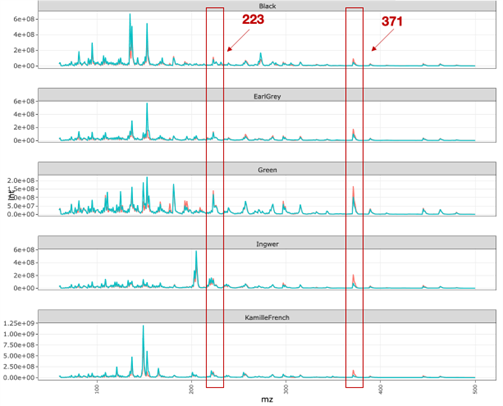
Figure 3: Mass spectra overlay showing elevated m/z 223 and 371 in tea bag vs. leaf profiles across five varieties.
This required no dedicated extraction protocol, no targeted method, no additional preparation. It emerged from the same two-minute measurement used for variety classification. That is the practical value of full-scan MS without a chromatographic filter: information that wasn’t being looked for can still appear and be acted on.
Olive Oil Origin Verification by Chromatography-Free MS Analysis
Tea is a useful analytical showcase. Olive oil is where the same approach meets a broader regulatory reality that most people have encountered, if not in the lab, then at the grocery store.
Olive oil fraud detection is a persistent challenge for regulators and producers alike. EU regulations require declared geographic origin for extra virgin olive oil, and economically motivated adulteration is well-documented across the supply chain. Conventional authentication relies on fatty acid profiling by GC or NMR-based metabolomics, both of which involve substantial sample preparation and instrument time.
Seven extra virgin olive oils from different origins were analyzed using the identical headspace method. PCA-LDA on the resulting profiles showed clear differentiation by geographic origin, driven by terpene composition and volatile fatty acid ratios, without extraction, derivatization, or chromatographic separation. Same setup, same two minutes, different question.
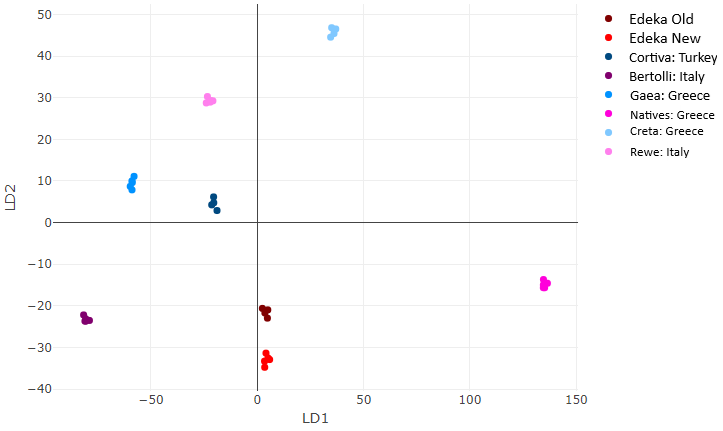
Figure 4: PCA-LDA score plot of seven extra virgin olive oils classified by geographic origin.
Chromatography-Free Screening: Throughput and Workflow Benefits
A 60-position autosampler running two-minute headspace measurements processes about 25 samples per hour. No solvent consumption, no column wear, no method development per analyte class. The chemometric model is built once and applied continuously; new samples are classified against the reference library in real time. For incoming goods inspection, supplier qualification, or routine quality monitoring, this changes the economics of screening substantially.
The approach also scales by instrument tier. The results shown here used a compact single-quadrupole. Where higher resolution is needed, to resolve terpene isomers that overlap on a low-res instrument or to add exact mass confirmation, the same source and autosampler method runs on a QTOF without changing the sample preparation workflow, because there isn’t one.
Chromatography-free analysis is not a universal solution. Matrices with very low volatility, regulatory methods requiring compound-specific confirmation, and absolute quantification in complex backgrounds remain the domain of chromatography. Within its scope, it outperforms chromatographic screening not by being more powerful, but by being faster and simpler, and occasionally surfacing findings like packaging migration that a targeted method would never have looked for.
Image by Alice Pasqual on Unsplash.
This post was created with the assistance of AI and editorially reviewed.